Vol. 41 No. 5 - Highlights
Lyman-Birge-Hopfield emissions from electron-impact excited N2 (Vol. 41, No. 5)
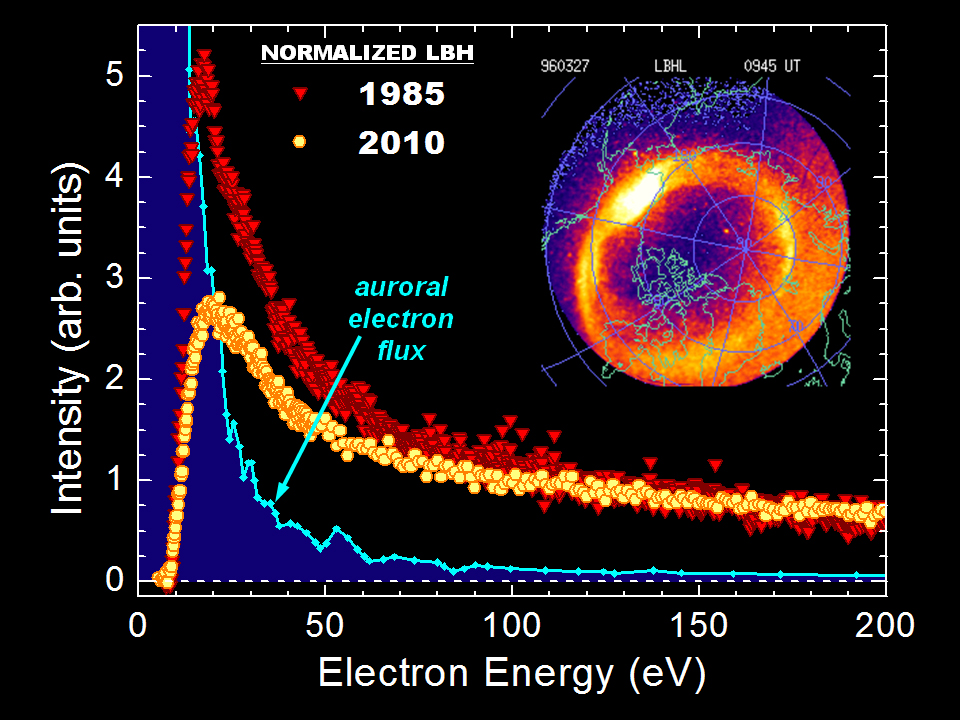 Electron impact induced LBH emission cross-sections of Ajello & Shemansky [J. Geophys. Res. 90, 9845,1985] and Young et al. [J. Phys. B 43, 135201, 2010] (normalized at ∼ 200eV). Also shown is a typical auroral (secondary) electron flux distribution (at 120km altitude) from Jones et al. [Planet. Space Sci. 54, 45, 2006] scaled to illustrate the abundance of low energy electrons. Inset: strong auroral and dayglow LBH emission intensities in the terrestrial northern hemisphere [credit: NASA].
The Lyman-Birge-Hopfield (LBH) band system of N2 (a1Πg → X1Σ+,g ) is one of the most prominent emissions in Earth's upper atmosphere. LBH emissions are excited primarily through collisions with electrons, frequently produced by ionizing solar radiation and the solar wind. Strong LBH emissions also radiate from the nitrogen atmosphere of Titan, Saturn's largest moon. Space programs (NASA, ESA…) have launched numerous satellites with UV spectrometers to monitor these emissions.
Recently, LBH emissions resulting from electron impact excitation of N2 into the metastable a1Πg state were re-examined. By careful attention to numerous experimental variables, such as background signal rates and pressure dependence, more broadly reproducible cross-sections were obtained. Surprisingly, the results differ significantly from the widely accepted benchmark published 25 years ago, which was found to be in error. This new study indicates that the LBH emission cross-section changes more gradually with electron impact energy than previously thought.
The results of this experiment can now be used by aeronomers to better determine the type and energy of collisions responsible for atmospheric radiation. LBH band emissions provide a sensitive diagnostic of the glowing upper atmosphere. For instance, these emissions are used to infer the N2 density distribution and gas temperature, as well as the average energy and amount of electrons liberated by solar radiation (i.e., dayglow photoelectron flux) and auroral events. The changing spatial distribution of LBH emissions are important observables needed to model space weather, which can seriously upset or even interrupt satellite communications and disrupt power grids. These laboratory results will also improve the interpretation of Cassini-Huygens's ongoing observations of Titan.
Lyman-Birge-Hopfield emissions from electron-impact excited N2
J. A. Young, C. P. Malone, P. V. Johnson, J. M. Ajello, X. Liu and I. Kanik, J. Phys. B: At. Mol. Opt. Phys. 43 135201 (2010)
[Abstract]
Broad-band Coupling Transducers for Magneto-Inductive Cables (Vol. 41, No. 5)
 Flexible MI cable with 50 W coaxial connector.
Magneto-inductive (MI) waveguides are periodic structures that operate by magnetic coupling between a set of L-C resonators. A current in one element will create a magnetic field, which then induces a voltage in a neighbouring element. This voltage in turn sets up a new current, which creates a new field. In this way, current waves can propagate along a chain of coupled resonators. Magneto-inductive waves have been observed in arrays of elements formed from discrete capacitors and inductors, and also in split ring resonators. More recently, a flexible cable has been introduced, which allows the inductors and capacitors to be printed, by patterning copper layers on either side of a thin polyimide substrate. MI waveguides allow band-pass propagation at frequencies ranging from MHz to GHz, for applications ranging from data cables to safety-critical interconnects. Other applications include near field lenses, field concentrators and detectors for magnetic resonance imaging.
The performance of MI waveguides is steadily improving, Propagation losses have been reduced, and flexible cables allow bends with low reflection. However, a full range of components is needed before useful systems may be built. A key requirement is a simple method of connecting magneto-inductive and conventional systems. Since the characteristic impedance of a MI waveguide is both frequency-dependent and complex, this is not an easy task. This paper describes a very simple broadband resonant transducer capable of low-loss coupling between magneto-inductive waveguides and systems with real impedance. The transducer may even be formed automatically when a cable is cut, allowing MI waveguides to be spliced to conventional systems. This development should open up the new possibilities for practical applications of MI waves.
Broad-band Coupling Transducers for Magneto-Inductive Cables
R.R.A.Syms, L.Solymar and I.R.Young, J. Phys. D: Appl. Phys. 43, 285003 (2010)
[Abstract]
Acoustic surface plasmon on Cu(111) (Vol. 41, No. 5)
 Theoretically simulated electron surface wave patterns created by a point charge located close to a metal surface: The conventional Friedel oscillations (bottom) and a snapshot of the dynamical ASP wave (top) propagating from the center.
An acoustic surface plasmon (ASP) is a novel collective electronic excitation at metal surfaces. This new mode has a linear (or acoustic-like) dispersion, i.e. it can be excited at very low energy and wavelength, allowing it to participate in many dynamical processes, such as chemical reactions and nano-sensors at surfaces and sub-wavelength optics and photonic devices as well as new microscopy techniques.
After the original discovery of an ASP on the close-packed surface of beryllium it now has also been excited and detected on Cu(111). Thus, the ASP is indeed a general phenomenon on metal surfaces that support a partially occupied surface state within a wide bulk energy gap. Non-local screening of the surface electrons due to bulk electrons creates the ASP.
Of particular interest is the interaction of the ASP with light: nm-size objects at surfaces, such as atomic steps or molecular structures, can provide coupling between light and ASPs of much lower wavelength than conventional SPs. In this way, the new mode can serve as a tool to confine light in a broad frequency range up to optical frequencies on surface areas of a few nanometers, thus facilitating control of events at metal surfaces with both high spatial (nm) and high temporal (fs) resolution. Another consequence of the acoustic-like character of the ASP dispersion is that both phase and group velocities are the same, so signals can be transmitted undistorted along the surface. The theoretically estimated ASP decay lengths of 100 ∼ 1,000 nm for medium (100 meV) to far (10 meV) infrared are an appealing prospect for the field of nano-optics.
Acoustic surface plasmon on Cu(111)
K. Pohl, B. Diaconescu, G. Vercelli, L. Vattuone, V. M. Silkin, E. V. Chulkov, P. M. Echenique and M. Rocca, EPL 90, 57006 (2010)
[Abstract]
A more efficient plasma sterilizer for medical devices (Vol. 41, No. 5)
 B. atrophaeus spore survival curves under four operating protocols: afterglow exposure (AE) at 12 °C; preheating at 52 °C followed, 3 h after, by AE at 12 °C; AE at 12 °C followed, 3 h after, by heating at 52 °C; AE at 52 °C.
Bacterial endospores, the most resistant microorganisms, can be inactivated by exposure to UV photons of the outflow of an N2-O2 discharge at reduced pressure (5 Torr). These photons are formed through N and O atom collisions in the discharge afterglow, which generate NOγ excited molecules emitting in the 180-270 nm range (UV-C). Some of these N and O atoms can diffuse prior to combining into NO molecules, ensuring, contrary to UV lamps, inactivation within holes and crevices. These photons create lethal damage to the spore DNA, at a rate that increases with the spore-deposit temperature. At 68 °C, the number of survivors of B. atrophaeus spores after a 30 min exposure is one log less compared to 28 °C, hence a shorter sterilization process. Such behaviour occurs only when heat is applied, neither before nor after, but simultaneously with UV photons (figure): inactivation does not result from the addition of sub-lethal damage caused independently by UV radiation and by heat.
Heat provides the energy required to surmount the (small) potential barrier(s) encountered as the chemical reaction leading to the DNA lesion, once initiated by photon excitation, proceeds. The energy barrier corresponds to molecular (conformation) rearrangements, as the reaction develops to reach the final chemical state on the DNA strand. Assuming Arrhenius-law dependence on temperature, the activation energy supplied by heat is 54 kJ/mol compared to that by photoexcitation, estimated ∼ 440-460 kJ/mol, as for many chemical reactions. To the authors' knowledge, it is the first time that such a genuine synergy effect is demonstrated.
Synergy effect of heat and UV photons on bacterial-spore inactivation in an N2-O2 plasma-afterglow sterilizer
M. K. Boudam and M. Moisan, J. Phys. D: Appl. Phys. 43 295202 (2010)
[Abstract]
Compact Stark slower for polar molecules (Vol. 41, No. 5)
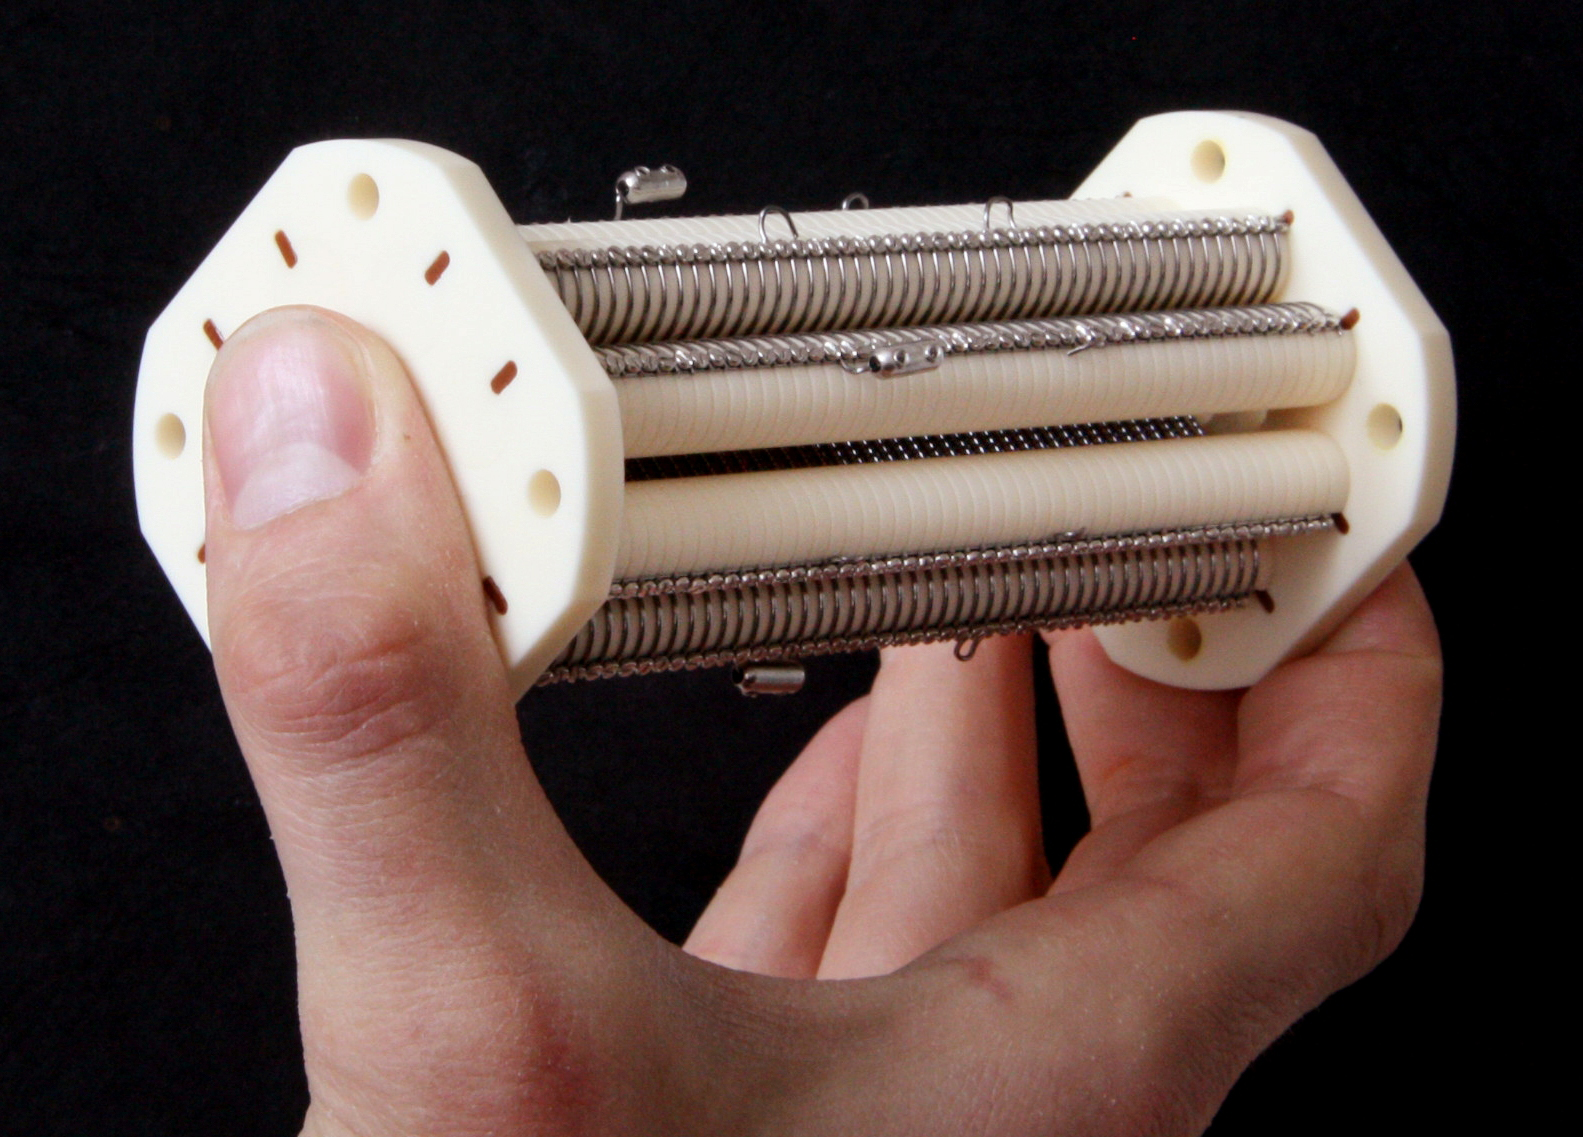 Photograph of the hand-held wire Stark decelerator
Over the last decade, a variety of new tools have been developed to manipulate the motion of polar molecules, such as carbon monoxide (CO) and ammonia (NH3), by using time-varying electric fields. It has been demonstrated that a beam of neutral polar molecules can be tuned to an arbitrarily low velocity - or even brought to a standstill - with a so-called Stark decelerator.
The operation principle of a Stark decelerator exploits the interaction between the polar molecules and electric fields and is similar to the manipulation of charged particles in a linear accelerator (LINAC). When a molecule in the appropriate quantum state moves through an inhomogeneous electric field, it gains "Stark energy" at the expense of its kinetic energy. Sending molecules through an array of such electric fields stages causes them to successively lose kinetic energy. The group of slow molecules that emerge from the decelerator is extremely mono-energetic, and can be used for various applications, ranging from high-resolution spectroscopy to trapping and molecular collision experiments.
The new Stark decelerator, shown in the photograph, uses tantalum wires instead of steel electrodes to create the electric field stages. This shortens the length of the decelerator by a factor of 10, to about 10 cm, yet still allows for full control over the molecules. This compact beamline is simple and easy to implement, and is also ultra-high vacuum (UHV) compatible. The latter feature makes the new Stark decelerator particularly attractive for use with cold-atom set-ups, in which UHV conditions are required.
Slowing polar molecules using a wire Stark decelerator
A. Marian, H. Haak, P. Geng and G. Meijer, Eur. Phys. J. D 59, 179 (2010)
[Abstract] | [PDF]
The relationship between quality and quantity in research (Vol. 41, No. 5)
 The quality of research groups plotted against the quantity of group members in physics
A new sociophysics model has led to quantification of the hitherto intuitive notion of critical mass in research. By treating research groups as complex systems, in which interactions between individuals are taken into account, a relationship between quality and quantity has been established. The model posits that the collaborative effect dominates quality, being an order of magnitude stronger than other factors such as individual calibre or institutional prestige. This means the strength of a research community is greater than the sum of its parts.
The research shows that there exist two critical masses, the sizes of which are discipline dependent. A small group is vulnerable and must strive to achieve the lower critical mass. Up to approximately twice this value, research quality is strongly dependent on the quantity of researchers. However, once beyond the value of the upper critical mass, research quality does not significantly improve with team quantity (the figure illustrates this for physics). The upper critical mass is interpreted as the maximum number of colleagues with whom an individual researcher can meaningfully communicate. When a group grows larger than this value, it tends to fragment. The lower critical mass is half the upper value, and for biology, physics and Earth sciences is 10, 13, and 15, while for pure and applied mathematics is about 2 and 6 respectively.
The research draws on data from evaluation exercises in Britain and France and suggests that to maximise the overall strength of a discipline, it is best to provide support for medium-size research teams to help them reach the upper critical mass, but that a policy of continued concentration is less effective above this limit.
The extensive nature of group quality
R. Kenna and B. Berche, EPL, 90, 58002 (2010)
[Abstract]
One-D neutron-polarization analysis on magnetic nanostructures (Vol. 41, No. 5)
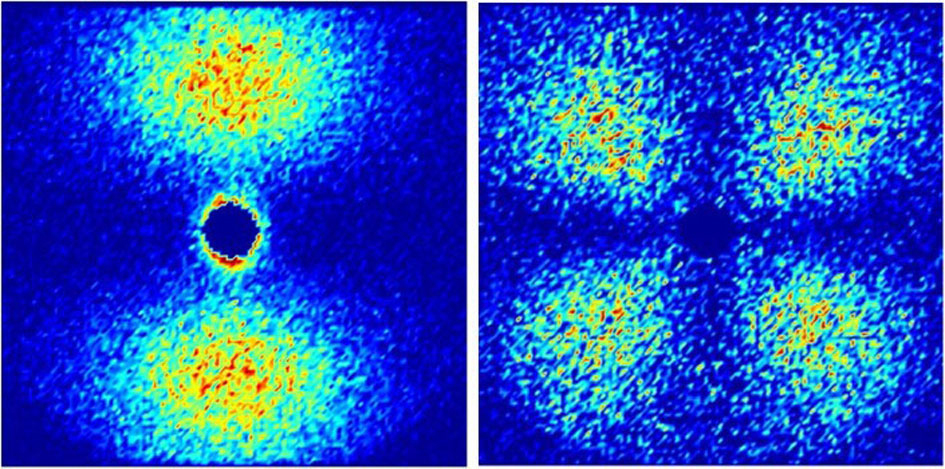 Neutron non-spin-flip (left) and spin-flip scattering cross section of a nanocrystalline Fe-Cr-based alloy at magnetic saturation (B0 = 1.31 T).
Small-angle neutron scattering (SANS) is a prominent and powerful method to investigate the bulk of magnetic nanostructures on a length scale between a few and a few hundred nanometers. However, up to now, SANS was almost exclusively utilized with an unpolarized or a polarized incident neutron beam (denoted as SANSPOL), and an analysis of the spin state of the neutron after the scattering process is frequently not performed. The recent development of efficient 3He spin filters (for cold neutrons) allows one to perform routinely one-dimensional neutron-polarization analysis (POLARIS) in a SANS experiment. The general equations for the non-spin-flip (nsf) and spin-flip (sf) POLARIS cross sections of a bulk ferromagnet suggest that a variety of angular anisotropies and asymmetries may be observed on a two dimensional detector.
First experiments on an FeCr based two-phase nanocrystalline alloy demonstrate the power of the POLARIS technique for the investigation of magnetic nanostructures. In particular, the analysis of the sf data, which does not contain the coherent nuclear scattering, permits the independent determination of the magnitude-squares of the three vector (Fourier) components of the bulk magnetization. In the figure below, the nsf data (left image) is a superposition of nuclear and magnetic scattering, whereas the sf channel at magnetic saturation (right image) exclusively contains the signal due to longitudinal (Mz) magnetization fluctuations; analysis of the sf data along certain directions in momentum space provides access to the transversal (Mx and My) spin components. Such studies are now feasible at the SANS instrument D22 of the Institut Laue-Langevin, Grenoble.
Longitudinal polarization analysis in small-angle neutron scattering
D. Honecker, A. Ferdinand, F. Döbrich, C.D. Dewhurst, A. Wiedenmann, C. Gómez-Polo, K. Suzuki and A. Michels, Eur. Phys. J. B 76, 209 (2010).
[Abstract] | [PDF]
Drag forces in fluctuating classical field (Vol. 41, No. 5)
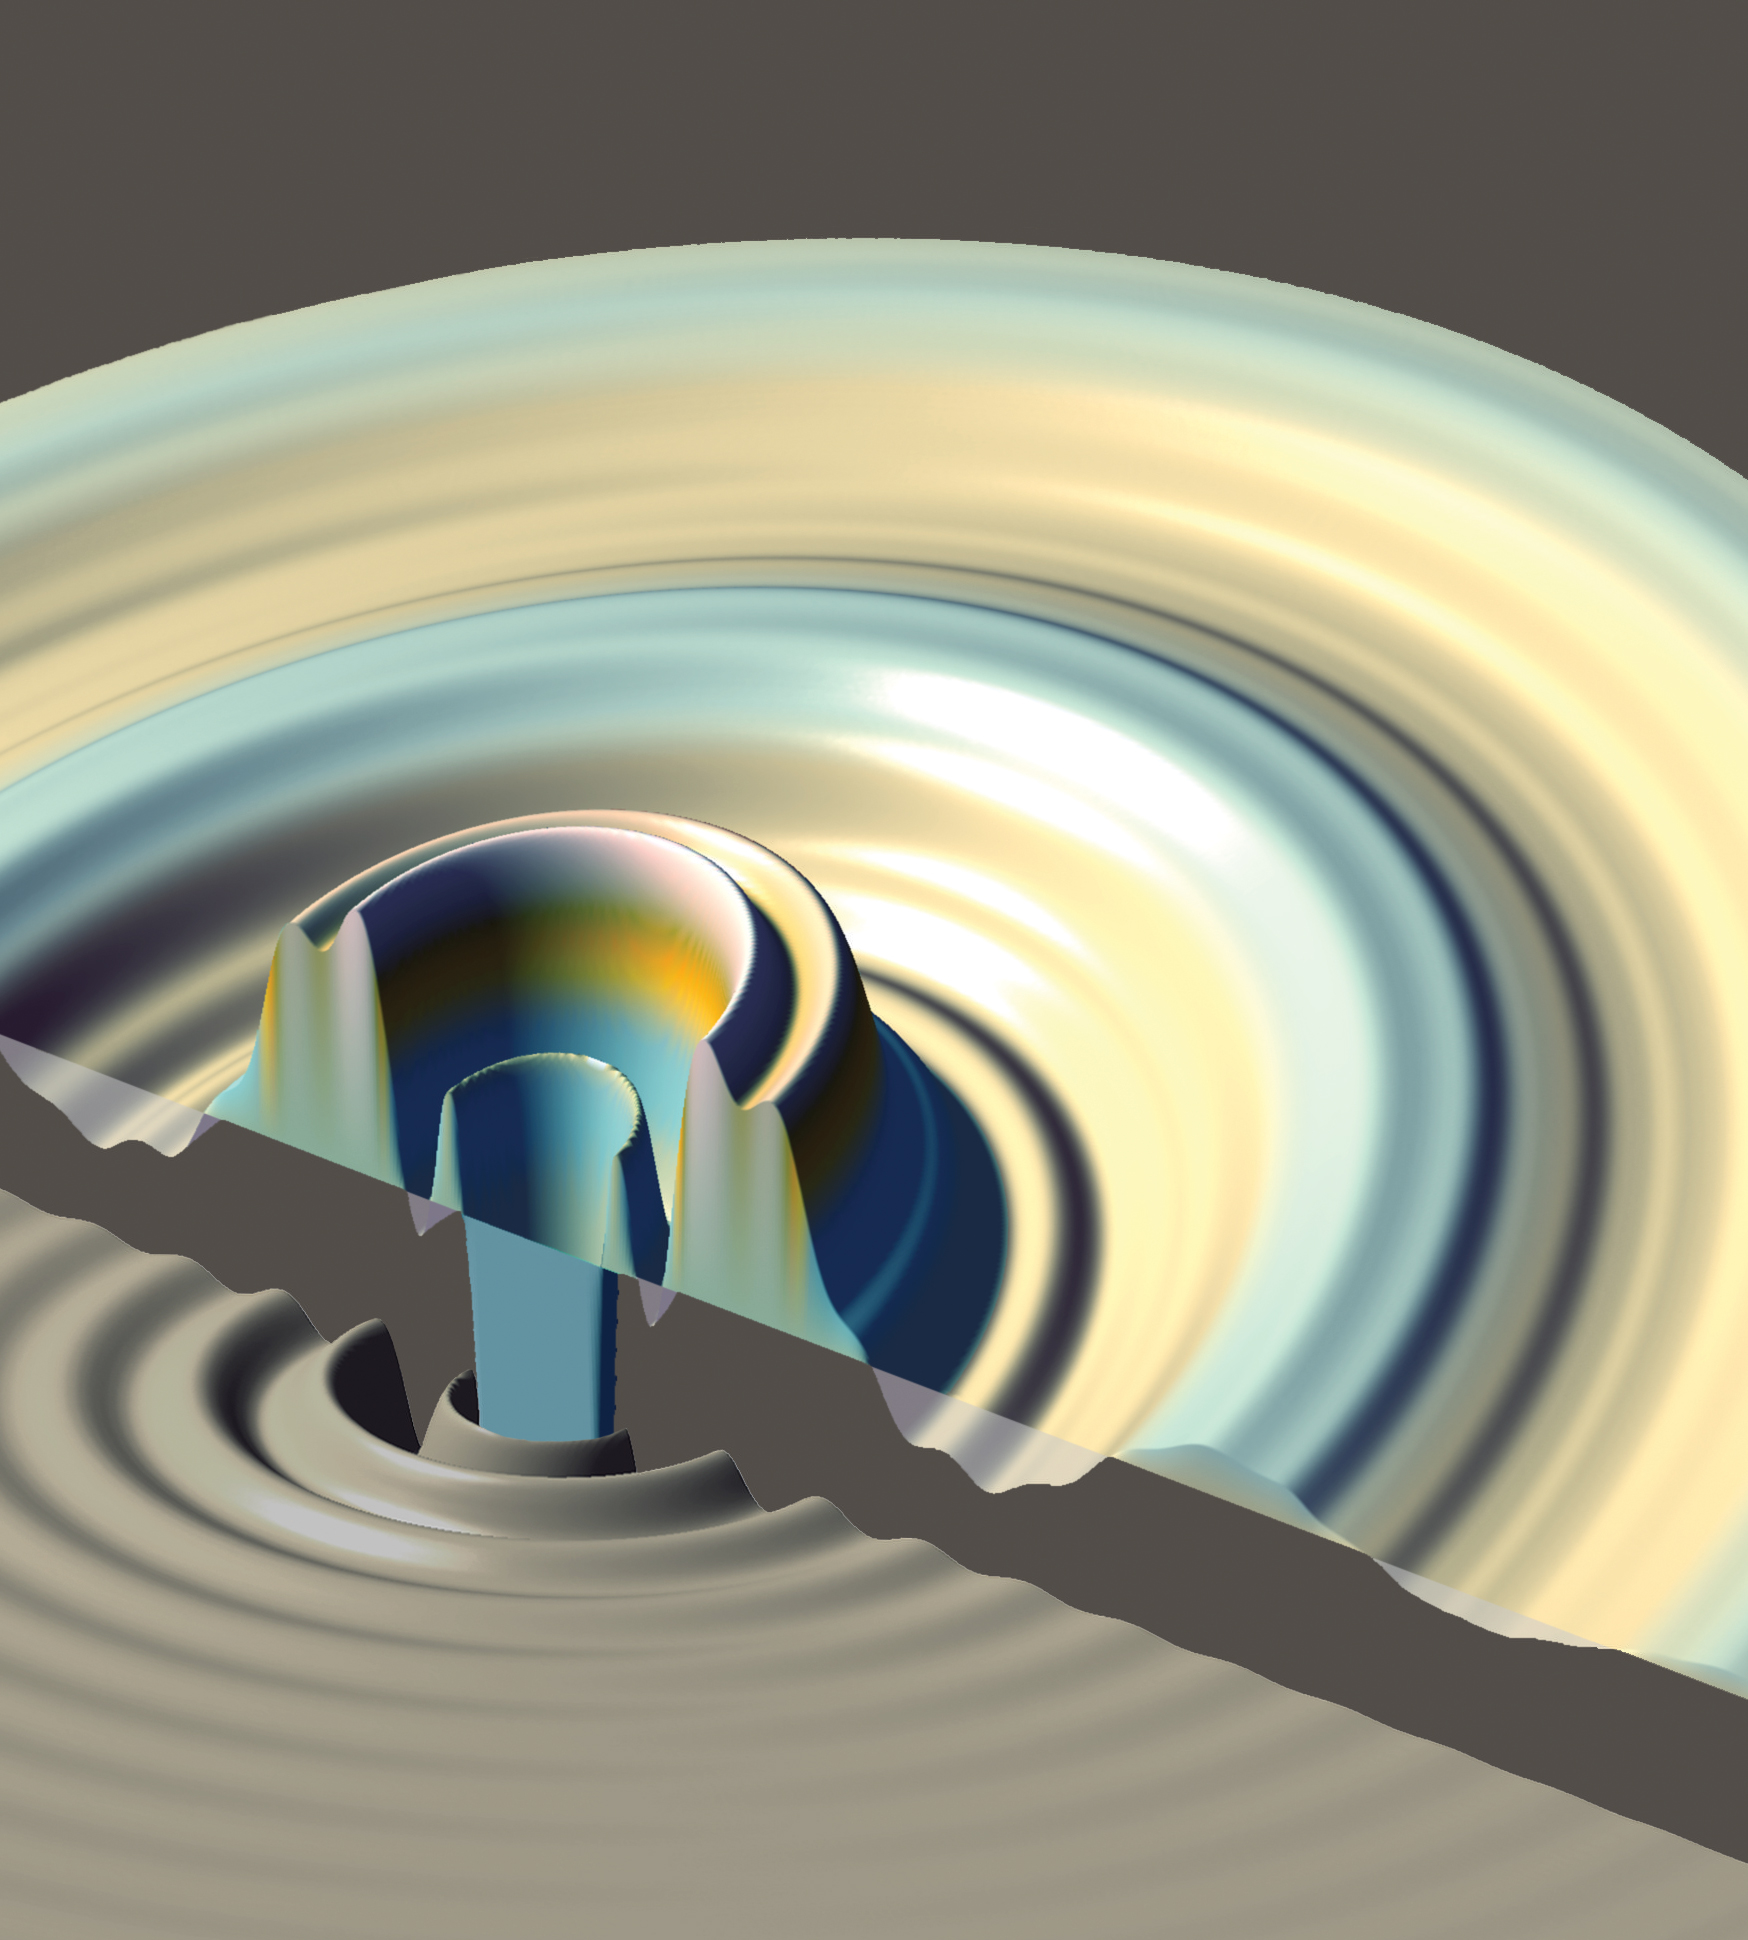
 Simulation of the average magnetization profile (in the rest frame of the magnetic field) about a point like magnetic field in an Ising model moving at constant velocity. The resolution in the figure represents the average magnetization of the spin at the centre of the square on the Ising model's square lattice.
Identical objects in thermally fluctuating fields experience a fluctuation induced force between them, examples include the famous critical Casimir force (generated by thermal rather than quantum fluctuations) [Fisher and de Gennes, C. R. Acad. Sci. Paris B 287, 207 (1978)] and forces induced between proteins in lipid membranes via their coupling to membrane height or composition [Goulian, Bruinsma, and Pincus, Europhys. Lett. 22, 145 (1993)] degrees of freedom. Gaussian fields, linearly coupled to the position of a moving inclusion the field can also induce a drag force as studied here.
The underlying physics is similar to that of a polaron - for a stationary inclusion, the polarization of the field is spherically symmetric, however when it moves the polarization field is deformed, see Figure 1, and this deformation yields a drag. The drag force depends on the statics and dynamics of the field and the inclusion's interaction with the field. At low velocities v the drag force is generically linear in v, but for systems with long range correlations, such as fields at critical points (for instance the continuous demixing transition for lipid membranes), the drag force can behave nonanalytically as vΦ, where Φ<1. As the velocity is increased, the drag force increases to a maximum and then decays to zero as 1/v. This is because at high velocity the polarization cloud does not have sufficient time to develop and the drag is thus reduced. These effects could be measured experimentally, for example on membrane proteins dragged in membranes or on colloids dragged through binary liquid mixtures, using optical tweezers.
Drag forces on inclusions in classical fields with dissipative dynamics
V. Démery and D.S. Dean, Eur. Phys. J. E 32, 377-390 (2010)
[Abstract] | [PDF]
Geyser oscillations in the vacuum expansion of solid He (Vol. 41, No. 5)
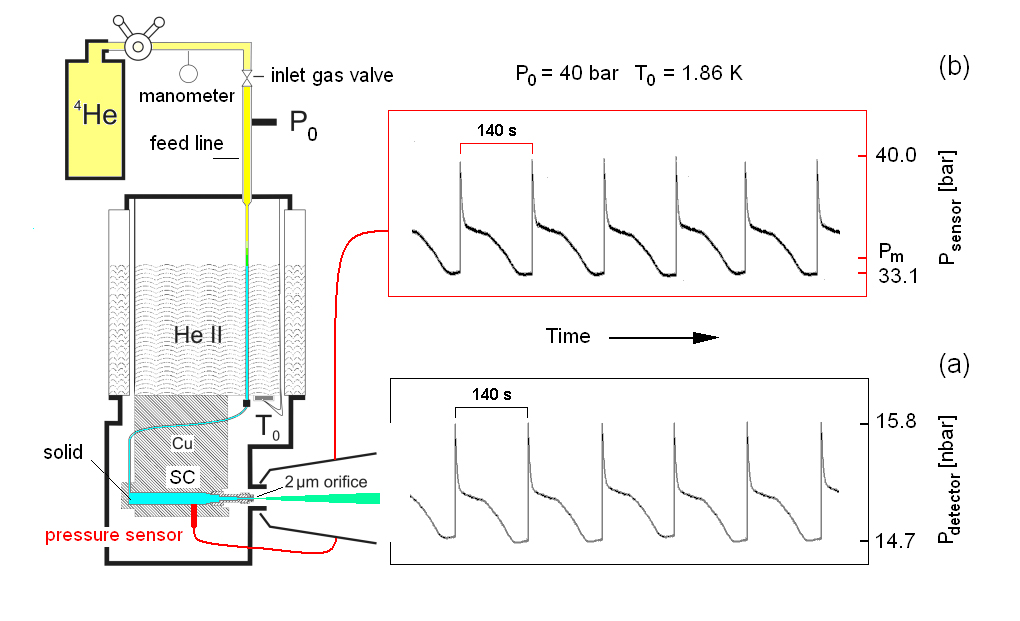 Vacuum expansion of solid 4He exhibits identical oscillations in flow (a) in the source chamber (SC) pressure (b), thus providing new insight into the geyser effect.
Following Galli and Reatto's scenarios for the existence of the Andreev-Lifshitz supersolid phase of 4He as an effect of excess vacancies [J. Low Temp. Phys. 124, 197 (2001)], the vacuum expansion of solid He through a micrometric orifice was suggested to inject excess vacancies into the bulk [R. Grisenti et al, J. Electr. Spectr. 129, 201 (2003)]. Unexpectedly these vacuum expansion experiments exhibited, superimposed on the uniform He flow out of the orifice, spectacular periodic intensity bursts (geyser effect), with their period increasing for decreasing solid He temperatures or increasing pressures [G. Benedek et al, Phys. Rev. Lett. 95, 095301 (2005)]. Anomalies were observed at temperatures below the lambda point, in a restricted pressure domain of the solid just above the melting pressure, suggesting frictionless flow. These early measurements, almost contemporary to Kim and Chan torsional oscillator experiments [Nature 427, 225 (2004)], raised new questions about the effective role of vacancies in explaining the regular collapses of the solid leading to the geyser bursts.
The present study, while confirming the geyser effect over a wider temperature and pressure domains, provides an answer to those questions by monitoring the pressure inside the source and comparing data with the gas inlet valve (Figure) open and closed. The new results indicate that the geyser collapse does not occur near the orifice, as previously suggested, but at a plug in the feed line upstream of the source chamber. Each collapse is triggered by the increasing vacancy concentration which makes the solid behave much as a liquid. On this basis it is argued that vacuum expansion provides a novel approach for investigating exotic non-equilibrium phases of quantum solids such as helium.
The Geyser effect in the expansion of solid helium into vacuum
G. Benedek, P. Nieto, and J. P. Toennies, Eur. Phys. J. B 76, 237 (2010)
[Abstract] | [PDF]