


| Issue |
Europhysics News
Volume 57, Number 2, 2026
Education in the age of the AI
|
|
|---|---|---|
| Page(s) | 26 - 30 | |
| Section | Features | |
| DOI | https://doi.org/10.1051/epn/2026213 | |
| Published online | 29 May 2026 | |
Illuminating the past: the role of optical imaging in the interdisciplinary study of medieval manuscripts
1
Institute of Heritage Science (CNR-ISPC), National Research Council of Italy, Via Cardinale Guglielmo Sanfelice 8, 80134, Napoli, Italy
2
Sapienza University of Rome, Faculty of Literature, Piazzale Aldo Moro 5, 00185, Rome, Italy
Abstract
Optical imaging methods play a central role in the study of manuscripts, from digitization, digital image processing to multispectral and hyperspectral imaging, the latter extending into the domain of spectroscopy. Their non-invasive nature and strong diagnostic potential make them valuable, especially when integrated into an interdisciplinary workflow that guides the selection of areas to be analyzed and supports the data interpretation.
© European Physical Society, EDP Sciences, 2026
Illuminated manuscripts
The image of monks and nuns painstakingly copying words in solitude is inextricably linked to the Middle Ages. In illuminated manuscripts, this laborious work was elevated to an artform through miniatures, decorations, pigments, gold and silver.
These precious and unique historical documents reflect the craftsmanship of several specialized artisans, influenced by traditions and geographic area. Using a multi-analytical and multi-disciplinary approach, their study connects complementary perspectives from the textual and visual content, providing insights into the cultural context, artistic techniques, workshop practices and trade networks [1-6].
From Point Analysis to Imaging: The Role of Optical Techniques in Manuscript Studies
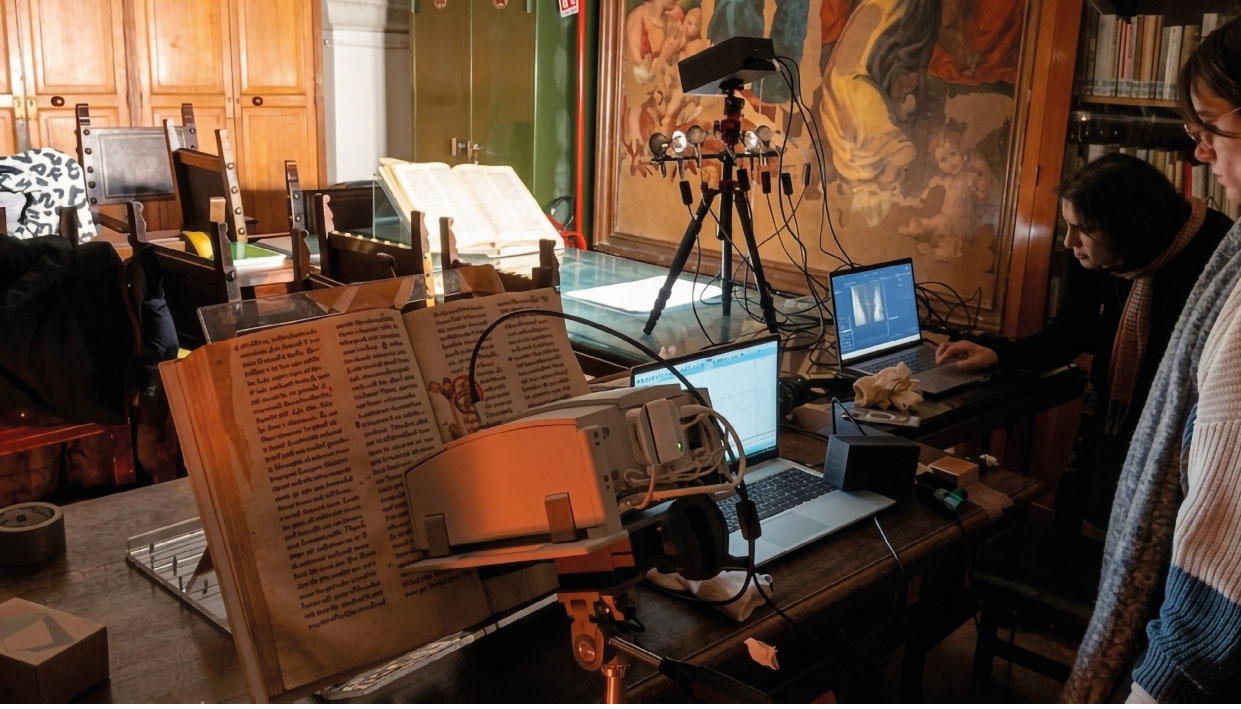
The analytical study of illuminated manuscripts relies mainly on non-invasive techniques to avoid sampling. Manuscripts are also sensitive to light, humidity, temperature fluctuations, and handling, so contact-based techniques are often restricted, while the use of illumination sources requires a risk assessment irradiation condition, including intensity, exposure time and spectral range. Moreover, in situ measurements are typically preferred, as the transportation of manuscripts is technically and administratively challenging.
Point-based methods such as Raman, Fiber Optic Reflectance Spectroscopy (FORS), Fourier Transform Infrared Reflectance Spectroscopy (FTIR), and X-ray fluorescence (XRF) are widely used to identify pigments, inks, and other materials [1-3]. However, because they probe only selected spots, they cannot fully represent the heterogeneity of manuscript surfaces. Scanning methods, e.g. macro X-ray fluorescence (MA-XRF), extend the analysis areas, but require more complex setup and longer acquisition times [2].
In this framework, optical imaging is particularly attractive, enabling non-contact acquisitions over extended areas, often with portable and rapid setups options.
The digitization of manuscripts using high resolution RGB images is a widespread application of optical imaging. Large-scale digitization campaigns led by libraries and cultural institutions are creating digital archives that support accessibility and long-term preservation. Beyond documentation, this process paves the way for digital image processing: mathematical methods have been successfully demonstrated for digital restoration, enhancement, and visualization of miniatures [4], while machine learning methods are being explored for text analysis and pattern recognition [5].
Exploring other regions of the electromagnetic spectrum, UV-induced fluorescence imaging is effective in revealing restorations, degradation products, and organic colorants that would otherwise be difficult to distinguish visually, while infrared (IR) imaging enables the visualization of underdrawings, faded or erased text, and of the scriptio inferior in palimpsests [5-6]. A typical multispectral approach exploits the spectral differences between materials, elaborating false color composites, difference images, or principal component images to enhance the visualization of specific features. Fig. 1 illustrates this strategy on the crossed-out colophon of manuscript VII.D.71, listed in “Manoscritti datati del Sud: inventario, p. 90 n. 289” [6]. The figure shows different imaging modalities: visible, IR false colour (IRFC), UV false colour (UVFC), and a composite image, obtained as a linear combination of the previous ones, where the deleted text is readable.
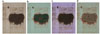 |
FIG. 1 (a) Visible image of manuscript VII.D.71, reproduced from Manoscritti datati del Sud: inventario (p. 90, no. 289); (b) false-color infrared image (c) falsecolor reflection ultraviolet image (d) composite image integrating multi-spectral data to improve the readability of the deleted colophon [6]. |
Further extending the acquisition to quasi-continuous spectral bands, hyperspectral imaging (HSI) enables the collection of a full reflectance spectrum for each pixel, generating a three-dimensional data cube (x, y, λ) that combines spatial and spectral information [3]. In manuscript studies, HSI in the VIS-NIR range is used to discriminate pigments, inks, parchment features, underdrawings, and erased or overwritten texts. It merges the benefits of spatial covering of imaging with the spectral discrimination power of spectroscopy, enabling materials to be mapped and, to some extent, identify materials over extended areas.
However, the data interpretation is not trivial. Data quality may be affected by illumination non-uniformity, detector response variability, and optical constraints, leading to striping or shading. Moreover, the measured reflectance, related to the optical properties of materials, is also influenced by factors such as surface roughness, parchment translucency, scattering effects, and illumination geometry. Thus, careful calibration is required to convert raw data into reliable reflectance values. In addition, the high dimensionality of hyperspectral datasets requires dedicated strategies for data analysis. Chemometric methods such as principal component analysis, spectral angle mapping, and spectral unmixing are commonly used to enhance spectral differences and classify materials, aiding data interpretation. Since each pixel typically contains a mixture of materials (e.g., pigments, binders, substrate), the data are frequently interpreted based on endmembers, representative spectral signatures of pure or dominant materials. From them, mixed pixel spectra can be modeled as combinations of a limited number of components.
Spatial and spectral resolution, both desirable for different analytical purposes, are in a trade-off for fixed acquisition conditions [3]. Moreover, their improvement is typically related to longer acquisition times, which cannot be overlooked: faster systems reduce manuscript exposure to artificial illumination and motion artifacts, while increasing the number of objects that can be examined in a limited timeframe.
It is also important to emphasize that in situ work in a library environment imposes significant practical constraints. While high-end laboratory systems offer excellent spectral resolution and broader wavelength ranges, they are typically difficult to deploy in confined spaces. Conversely, compact and lightweight devices come at the cost of performance. For instance, snapshot cameras provide speed and portability but suffer from fewer spectral bands and lower signal-to-noise ratios.
As a result, hyperspectral imaging always involves a compromise between spectral performance, spatial resolution, field of view, acquisition time, and portability.
Case study: “Obituario di Santo Spirito”, from Biblioteca Capitolare in Benevento, Italy
Manuscript 28 of the Chapter Library of Benevento (BCB) preserves the obituary and the register of the city brotherhood of the Holy Spirit, written in beneventan script and presented in April 1198 [7]. It documents the effective association in Benevento of secular clergy and lay members for spiritual safeguarding of the community. [8] Its definition, Obituary, is due to the latin verbal form obit (i.e. ‘died’), present at the beginning of each death recording. The Obituary contains valuable full-page miniatures (fols. 51v-52r, 53v-54r). The codex, now restored, is composed of 109 parchment leaves (263 × 185 mm), bound in pasteboard and brown leather. [7]
Fig. 2 reports the results from the application of Vis-NIR HSI to the Folio 90 verso, which includes both a figurative detail and adjacent written text (Fig. 2a). A portable Vis–NIR system (HERA, 400–1000 nm, NIREOS S.r.l.), based on a Fourier-transform architecture with a common-path birefringent interferometer and a monochrome CMOS detector, was employed. This configuration is compact, lightweight and stable against vibrations, and its spectral resolution is sufficient to enable pigment discrimination.
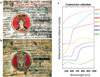 |
FIG. 2 (a) RGB image of the Folio 90 verso reconstructed from the 642 nm, 541 nm, and 460 nm bands of the hyperspectral datacube; (b) Spectral Angle Mapper (SAM) classification map obtained with the Spectral Hourglass Wizard routine; (c) endmembers extracted by the Spectral Hourglass Wizard, displayed in ascending order: copper green, indigo blue ink, red lake, gold, cinnabar, black ink, and parchment. Reproduced by permission of Ufficio diocesano per la Cultura e i Beni Culturali, Arcidiocesi di Benevento. |
The instrument was mounted on a tripod and operated with a portable and flexible illumination setup consisting of two halogen lamps and four UV LEDs. Hyperspectral cubes were captured in 10-30s (exposure time of 45ms, two averages per frame), with a single acquisition covering, when necessary, a whole folio.
Calibration included flat-field correction using a white cardboard sheet (A3, 250 g/m²) and radiometric correction based on dark and white references (Spectralon, Labsphere).
Post acquisition, the data cubes were analyzed in ENVI. Noise reduction was performed using a Minimum Noise Fraction (MNF) transformation [9], followed by the Spectral Hourglass Wizard routine [10] to extract endmembers and classify pixels (Fig. 2b) through the Spectral Angle Mapper (SAM) algorithm, with a tolerance angle of 0.15 rad.
The analysis identified eight spectral endmembers (Fig. 2c), allowing preliminary observations about the pigments and inks nature and distribution. One endmember (end 6) corresponds to cinnabar, showing the characteristic transition edge at 598 nm, while an endmember related to blue indigo-dye ink (end 2) mapped in a single written name (“primicerus robertus”). The black ink (end 7) could not be unambiguously assigned: it possibly represents iron-gall or carbon-based ink, with spectral variations likely due to aging rather than material differences. Gold (end 4) was localized in decorative elements, likely applied as powder with a mordant, and the green areas corresponded to a copper-based pigment (end 1). The pinkish areas proved more challenging to interpret and may be associated with the use of a red lake (end 3). The spectral response of such materials can vary significantly depending on dye concentration, particle size distribution, and the nature of the metal–dye complex, leading to poorly distinctive spectral features and reduced diagnostic specificity, which complicates unambiguous identification. As expected, this folio shows different inks and marks of erased text, suggesting that it was used at different times to record multiple entries. These features make it a rich case study for exploring both the palette and writing practices employed over time.
No man is an island: the necessity of a collaborative approach
Although informative, optical imaging cannot answer all the research questions raised in the study of illuminated manuscripts. Even when imaging and spectroscopy are combined, as in HSI, the integration with additional analytical techniques is a necessity. This practice, common in heritage science, requires coordination not only between disciplines, but also between different instrumental approaches, acquisition times and logistical constraints.
The Beneventan case of study was carried out within a broader MOLAB campaign [11], part of E-RIHS, the European Research Infrastructure for Heritage Science, which provides portable analytical instrumentation for in situ studies of heritage objects [3,11]. Held at the Biblioteca Capitolare in Benevento, the campaign focused on a variegated collection of 12th-century manuscripts associated with local scriptoria. The main aim was to assess whether manuscripts produced in the same cultural and geographical context shared common materials and techniques, or whether significant differences could be identified among production centers. To address this question, folios from four manuscripts, including hagiographic lectionaries, breviaries, and an obituary, were examined over three days, integrating hyperspectral imaging with point-based techniques such as FORS, FTIR, and Raman spectroscopy.
Within such articulated multi-analytical campaigns, workflow optimization is essential. Imaging methods are often the first investigative step, as they rapidly provide spatially resolved information, guiding the selection of representative locations for subsequent point analyses. In our case, HSI was used in this capacity, exploiting its rapid spectral mapping capabilities to identify regions with distinct spectral features. Moreover, the hyperspectral measurements provided a preliminary characterization of the manuscript palette: similar sets of endmembers were found across the examined manuscripts, suggesting shared materials and techniques within the Beneventan production context.
Overall, this study confirms the value of hyperspectral imaging both as a stand-alone technique and as part of a broader multi-technique framework, where it demonstrates the ability to guide, connect, and enhance the wider analytical process.
Acknowledgements
The authors gratefully acknowledge Prof. Mons. Mario Iadanza, Head of the Office of Cultural Heritage and Sacred Art of the Archdiocese of Benevento and Director of the Biblioteca Capitolare di Benevento, for his support and for authorizing this publication. The MOLAB diagnostic campaign was supported by E-RIHS, with financial support from the Italian Ministry of University and Research (MUR) through the FOE E-RIHS IT funding. The research was also supported by the FOE project ‘Culture and Creativity in Green and Digital Transitions for an Inclusive Society’.
About the Authors

Margherita Giugni is a PhD student in the interdisciplinary doctoral programme in Heritage Science at Sapienza University of Rome, supported by E-RIHS IT. She conducts her research at the CNR-ISPC Officine Capodimonte laboratory in Naples, focusing on the application of hyperspectral imaging and multi-analytical techniques to the study of painting stratigraphy.
Francesco Di Concilio is a PhD student in the inter-disciplinary doctoral programme in Heritage Science at Sapienza University of Rome, supported by E-RIHS IT. His field of study is the historical reconstruction of the production contexts of southern italy medieval manuscripts.

Teresa Cacace is a physicist specializing in optics and coherent imaging, with expertise in non-invasive diagnostics for cultural heritage, currently working at the Institute of Heritage Science (CNR).
References
- Aceto, Maurizio, et al., Spectrochimica Acta Part A: Molecular and Biomolecular Spectroscopy 91, 352 (2012) [Google Scholar]
- Delaney, John K. et al., Studies in Conservation 59.2, 91 (2014) [Google Scholar]
- Doherty, Brenda, et al., Spectrochimica Acta Part A: Molecular and Biomolecular Spectroscopy 115, 330 (2013) [Google Scholar]
- Calatroni, Luca, et al., Herit Sci 6, 56 (2018) [Google Scholar]
- Vera Isabell Schwarz-Ricci, Handwritten Text Recognition per registri notarili (secc. XV-XVI): una sperimentazione, « Umanistica Digitale », 13, 171 (2022) [Google Scholar]
- D. P. Pavone and V. I. Schwarz-Ricci, Applicazione della fotografia tecnica con procedure di post-processing a un colophon depennato. Il ms. VII.D.71 della Biblioteca Nazionale di Napoli: un nuovo manoscritto autografo di Maffeo Vallaresso. Zenodo (2024) [Google Scholar]
- J. Mallet and A. Thibaut. “Les manuscrits en écriture bénéventaine de la Bibliothèque capitulaire de Bénévent. Tome III: Formulaires liturgiques (offices). Tables et index.” Documents, études et répertoires de l’Institut de Recherche et d’Histoire des Textes 3 1.3, 126 (1997) [Google Scholar]
- G. T. Colesanti and E. Sakellariou, Benevento, una città tra regno e papato: il ruolo delle confraternite nelle dinamiche istituzionali cittadine, in Città nel Mezzogiorno d’Italia tra XI e XV secolo, a cura di F. Panarelli (Mondi Mediterranei), Potenza, Basilicata University Press, 206 (2024) [Google Scholar]
- A. A. Green et al., IEEE Transactions on geoscience and remote sensing 26.1, 65 (1988) [Google Scholar]
- J. W. Boardman, “Automating spectral unmixing of AVIRIS data using convex geometry concepts.” JPL, Summaries of the 4th Annual JPL Airborne Geoscience Workshop. Volume 1: AVIRIS Workshop (1993) [Google Scholar]
- C. Miliani et al., Accounts of chemical research 43.6, 728 (2010) [Google Scholar]
All Figures
|
FIG. 1 (a) Visible image of manuscript VII.D.71, reproduced from Manoscritti datati del Sud: inventario (p. 90, no. 289); (b) false-color infrared image (c) falsecolor reflection ultraviolet image (d) composite image integrating multi-spectral data to improve the readability of the deleted colophon [6]. |
| In the text | |
|
FIG. 2 (a) RGB image of the Folio 90 verso reconstructed from the 642 nm, 541 nm, and 460 nm bands of the hyperspectral datacube; (b) Spectral Angle Mapper (SAM) classification map obtained with the Spectral Hourglass Wizard routine; (c) endmembers extracted by the Spectral Hourglass Wizard, displayed in ascending order: copper green, indigo blue ink, red lake, gold, cinnabar, black ink, and parchment. Reproduced by permission of Ufficio diocesano per la Cultura e i Beni Culturali, Arcidiocesi di Benevento. |
| In the text | |
Current usage metrics show cumulative count of Article Views (full-text article views including HTML views, PDF and ePub downloads, according to the available data) and Abstracts Views on Vision4Press platform.
Data correspond to usage on the plateform after 2015. The current usage metrics is available 48-96 hours after online publication and is updated daily on week days.
Initial download of the metrics may take a while.